
 Thanks:
  Likes:
  Dislikes:


Still missing the point. Instead of thinking for yourself, you continue to cite websites that are not reputable sources of scientific information.Originally Posted by El Kabong

The first graphic is posted here:
Global Temperature Update: No global warming at all for 17 years 8 months – No Warming Since August 1996 | Climate Depot
Hmm. Scientific credibility? Do the people hosting this site have credible academic credentials? Hmmm...
Climate Depot - SourceWatch
Maybe not.
The second is a meme that may or may not depict accurate quotes from these three people. Also not what I challenged you to do. This is second hand information, at best. You would fail any course on research methods at any university in the world. Do you simply not know what a reputable source is? Memes, Wikipedia, and random websites do not constitute reputable sources. In order for these to count, you need to first establish the credibility of these people and then post audio or video links of them making these statements. These are hearsay. I'm not saying they aren't accurate, but the way you have presented them is very weak.
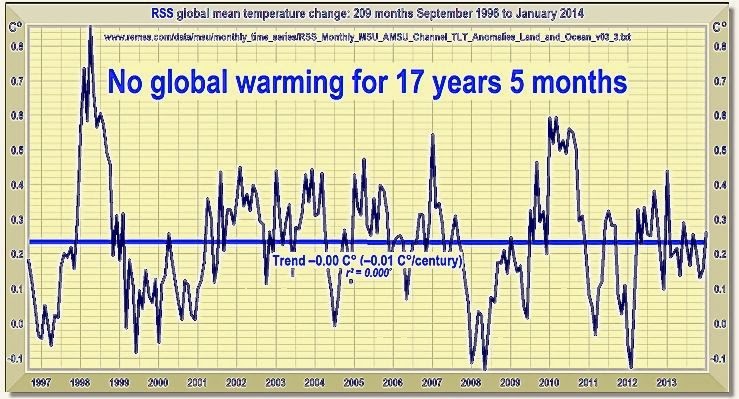
The third graphic is the most puzzling. Here is your claim again, to refresh your memory:
There has been 0 warming since 1998.
And you then post a graph with a line of best fit that clearly shows a positive increase, albeit small. I hate to break it to you, but by no measure on the planet is a positive number equal to zero (that's due to the trichotomy property of real numbers). Essentially you posted a graph that rebuts your claim as evidence of your claim. Wow.
All this is still beside the point. I want YOU to analyze any of the data sets published at any of the numerous links I provided for you. All of those are reputable sources; i.e., the data is made public with complete transparency so that anyone who wishes to contest the validity may do so. This is essential for "good" science.
I didn't ask you to post graphs from a website to go along with the quotes you've posted from yet other websites. I've seen these graphs before and here's the thing. I can explain why these are misrepresentations and - as you so eloquently put it - "bad science." Hell, one of em still has the link at the top! This is the whole point. You seem to have ZERO expertise to tell if these are "good" graphs or "bad" graphs.
You cannot tell me if these graphs are accurate or not. What was the methodology used to create the "line" that fits the data depicted in these graphs? This is where you provide an explanation: what methods were used to fit the data here (and you must be able to verify the authenticity of your answer)?
You cannot tell me if the data depicted in these graphs is accurate. I provided you with numerous links to verify the data for yourself, yet you persist in showing me things posted on a website. You should provide justification that this data is correct, or at least that it corresponds with publicly published data that is out there for the whole world to see, transparently. This is where you provide an answer: Does this data agree with that published by any reputable scientific source? (Again, you must provide some type of justification - "I got it from a website I trust" doesn't cut it. Compare this data with that published and verify its authenticity.)
You say you don't trust scientists, yet you trust the scientists that created these graphs - enough so that you present them as evidence. See the double standard?
Since I also have internet access, I too can visit the skeptic websites and see these graphs in all their glory. The issue is that you have ZERO expertise to ascertain if these graphs are accurate representations of the data or not. This is your challenge.
Use the published data to make a logical, scientific argument to support your case. Don't post someone else's results - that's plagiarism, and usually gets you a failing grade. I want to see your argument that supports your claim. So far all you've done is visited a bunch of websites with the same opinion as you. That's not evidence. That's lame.
I'm prepared to perform my analysis and present my conclusions, complete with logical arguments, empirical data, and statistical analysis. As soon as you make an honest effort to do the same, I'll present mine.
It is simple. Quit dancing around. Playing keyboard warrior doesn't cut it here. You bash my profession, so I'm calling you out.
Claim: There has been 0 warming since 1998.
Any time now.
 |
|


 Reply With Quote


 What is the point? It's overkill.
Bookmarks